Dowsing Archaeological Features;
An empirical study at Cressing Temple, Witham, Essex.
(TL799187).
32.Types of Reactions.
As is often the case with novice dowsers (Scott Elliot. J, 1990) the predominant reaction was that of the two rods crossing regardless of the feature detected. However a number recorded varying responses with the most common being the description of a full circle by one or both rods. In the case of Test 1; Dowsing for water, which gave the strongest responses, eight participants were able to determine the direction of the water flow. Only six recorded no response for the water main of which three went on to locate other features. Six participants recorded varying responses for the same feature type and this can attributed to dowsing the same feature but in different locations.
The understanding of the reactions and the nature of the features they are indicating is something that can only be obtained by experience and thus by practice. For the purposes of the tests however the trends indicate that it is possible for complete novices to pick up discernible signals that can be interpreted as indicating different types of features within the surveyed area.
33. Identifying features from the survey plots.

46a. A compilation of all the survey plots. At first it looks
a random jumble of crosses but examination of the repeated trends indicates
several stronger responses which correspond with known features on the site.
Figure 46a is a compilation of all the surveys made containing all the marks made by the participants but without any typographical comments. At first there appears to be total confusion and this is in some degree to the way some people chose to record their readings. However it can be seen in Figure 46b that there is a definite trend towards three large linear areas and several small circles that are plotted over and over. It is also evident, that human nature drove some people to walk solely between the grid points, rather than try to outline the anomalies they were reading.
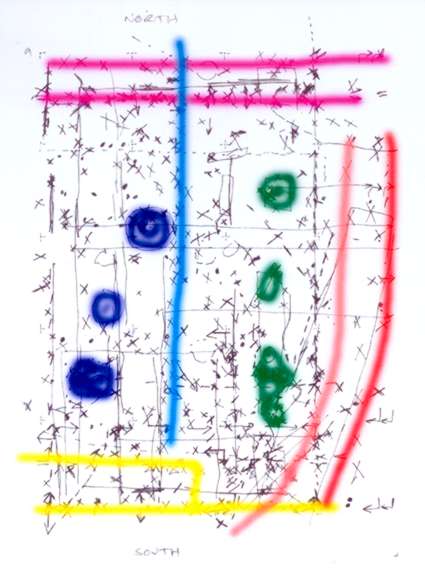
46b. The dowsing trends highlighted for clarity.
The density of the readings to the extreme north and extreme south of the grid is not coincidental. The area was chosen to overlay the excavations CT29 T1 and CT29 T3 and the west edge broaches BVAS IV. Whilst many people picked up the north and south excavations the west was less defined and this is most likely because the water main, (which everyone had previously dowsed in Test 1) was also here and so was dismissed as being already known. What is more interesting is the density of readings in grid squares L, M, O and P and also the number of coincident readings that were placed outside the gridded area to the east as the dowsers followed a stronger reading.

47. The 'total plot' overlaid onto the site. Now the correspondence
of features can be more easily seen.
Overlaying this 'total plot' onto the resistivity survey (Figure. 47) the following correlations can be seen;
1. To the extreme north there is a well defined east-west linear pattern which co-incidentally follows the gridlines and then is paired with a heavier linear pattern some two metres south. This relates to the footing of the Templar Chapel which, whilst having been sectioned during the BVAS excavations, is still in-situ. The delineation of these features is almost exact.
2. A few metres south again the irregular edge of the BVAS IV excavation area has been roughly outlined. The excavations were backfilled by a machine 'kindly supplied by Wimpey Construction' (Hope. J, 1980) and are unlikely to have crisp edges.
3. To the extreme south is a mass of linear readings overlaid by a large number of random plots. This is the backfilled excavation CT29 T1 which carries the footings of the Templar Hall and more significantly the Tudor culverts that were later emplaced to service the kitchen of the 'Greate House'.
4. The plots that fall out of the grid to the east including that drawn as an oblong all follow a trend shown on the remote sensing survey which can be safely assigned to the robbed out brick culvert which joins the sluice box in CT29 T3 to the kitchen waste pipe in CT29 T1 and then carries on out under the corner of the Granary.
5. The strong points in squares F, J and M correlate exactly with those shown on the resistivity survey and these are likely to be surface feeds to the culvert.
6. There are a number of other strong points that have also been symbolised by circles. It is probable that these are tree holes but one gave such a strong reaction that it has been marked as a well by Colin Peal and others. It would make sense to have a well near the kitchen block.
7. There is a line of crosses running directly up the centre of the grid that were all plotted by the same person. It is difficult to find any correlation for these so they might be considered as wishful thinking or possibly the misplacement of the BVAS edge of excavation.
![]()
Barry Hillman-Crouch. MSt PA, Dip FA, BSc, HND. Written 1999 Published on the web June 2005.